BusinessObjects Definitions
Universe #
Is a BusinessObjects specific term that indicates a set of tables in a ‘space’, making reporting possible for a specific purpose. The tables in the universe are ‘mirrors’ or ‘shortcuts’ to the original tables in the SICS database which is viewed through the universe. The universe visualizes the relationship between the database tables.
The Query Panel #
The Query Panel is where you build your report queries. You can access the Query Panel by:
- Creating a new query by selecting New from the File menu. This triggers the New Report Wizard.
- Creating a new query by selecting one of the options Table, Crosstab or Chart from the Insert menu.
- Editing an existing query by selecting Edit Data Provider from the Data menu.
The Query Panel consists of:
- The Classes and Objects pane, which shows all the reportable objects in the universe.
- The Result Objects pane, where you place the objects to be included in the query, and viewed in the report result.
- The Conditions pane (in Web Intelligence called Query Filters), where you set the conditions on the query in order to limit the amount of data retrieved from the database. If no conditions are set, all existing data for the selected result objects are retrieved.
Objects #
You select objects from the Classes and Objects pane when building a report. The objects represent field names as they appear on the screens in SICS.
There are three types of objects:
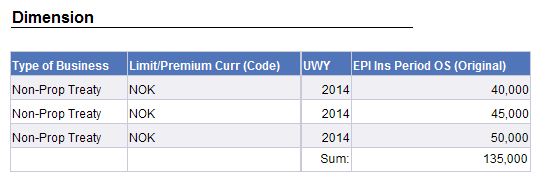
- Dimension(a blue rhomb), which shows every piece of information on each row.
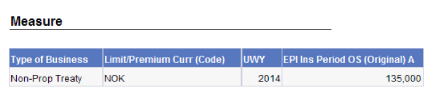
- Measure(an orange ruler), which shows aggregated information by which a Dimension object can be Measured.
- Detail (a green pyramid), which contains detailed data for a Dimension object.
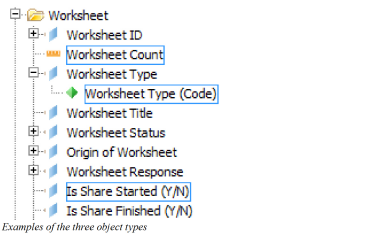
The objects are grouped into classes and subclasses, and where applicable they follow the structure of screens, tabs and navigation bars in SICS.
In some areas of the main universe there are two sets of objects where one is defined as Dimension and the other one as Measure. They are both extracting the same information, but the difference is that the Measure type has a ‘Sum’ function applied to it.
Depending on which type of object you use, the report result can be different. The below example illustrates how a report result looks like with an EPI object as a Dimension and as a Measure. The Dimension object shows the existing information row by row, while the Measure object considers the other columns in the report layout and aggregates the EPI for each level of the displayed information.