Functions in BusinessObjects
Creating a Local Variable #
Within your report document you have the possibility to create local variables (=objects) containing a formula based on any other information existing within the report.
You can access the Local Variable Editor in two ways:
- Right-mouse click in the Report Manager box and select New Variable from the menu (only an option in Desktop Intelligence).
- Select Variables from the Data menu, and then click the Add button.
The Variable Editor #
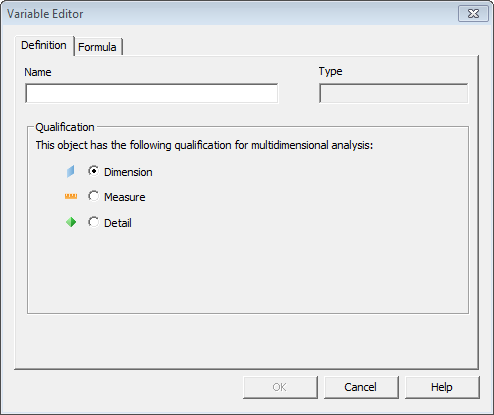
The Variable Editor dialog box has two tabs:
- The Definition tab, where you enter a suitable Name for your variable. Which object Type and Qualification you should use is recognized by BusinessObjects when the formula is entered.
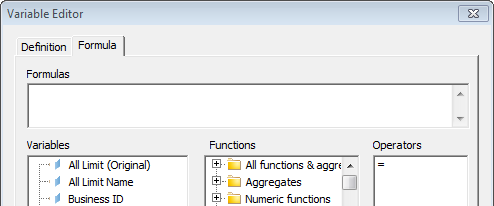
 2. The Formula tab, where you build your formula by selecting any of the existing variables of your report, and the available Functions and Operators. You can either enter the formula manually, or double-click the existing variables, functions and operators in the correct order.
 Your local variable is then available in the Report Manager box together with all the other regular objects.
You can insert your local variable in the report result by the drag-and-drop technique.
If you want to edit your local variable you right-mouse click in the Report Manager box and select Edit Variable.
Examples regarding Local Variables
1) Turn Rows into Columns
A report showing estimated items for Underwriters Estimate are by default displayed in rows.
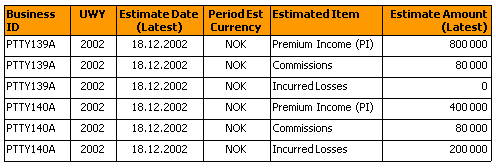
By creating local variables for the estimated items you can show the information in columns instead of rows.
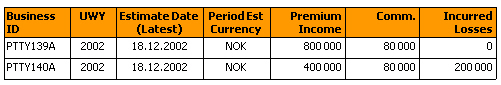
You have to create a local variable for each reference data value (three in this example). The formula for this kind of variable for the premium item would be:
=<Estimate Amount (Latest)> Where (<Estimated Item>= “Premium Income (PI)") 2) If, Then and Else Statements
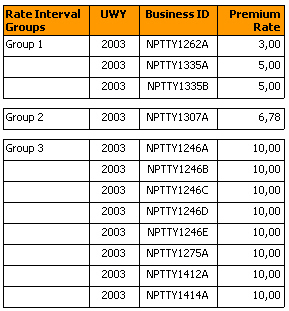
A report showing premium rates can for example be grouped into different rate intervals by creating a local variable, where the formula is based on object Premium Rate and If, Then and Else statements.
The formula for this kind of variable for grouping the premium rates can be defined like this:
= If <Premium Rate> Between (0, 5,0) Then “Group 1” Else If <Premium Rate> Between (5,1, 7,5) Then “Group 2” Else If <Premium Rate> Between (7,6, 10,0) Then “Group 3” A report result including this local variable can look like this:
3) The DaysBetween Function
With a local variable you can also count days between two date objects by using function DaysBetween.
For example the number of days between objects Today’s Date and Underwriting Year - Period End, would have a formula like this:
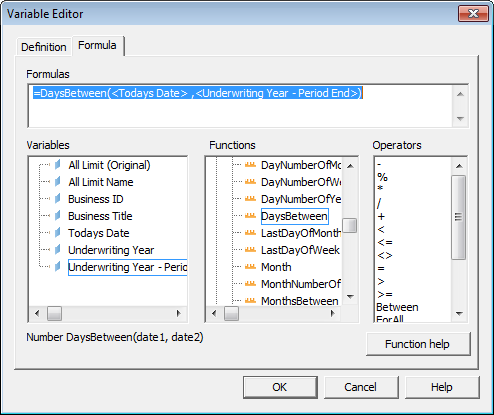
Note! When you select a Function, the formula structure is displayed, in this example “Number DaysBetween (date1, date2)”.
More information about each Function is also found via the Function help button.
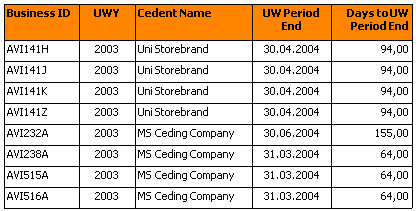
A report result with this kind of local variable can have this layout:
Creating Additional Queries #
Sometimes all information can not be retrieved by one query. Reasons for creating an additional query can for example be to avoid aggregation issues, or if the first query has necessary conditions limiting other data to be retrieved.
To Create an Additional Query:
In Desktop Intelligence:
Select New Data Provider from the Data menu, alternatively right-mouse click in the Report Manager box and select New Data Provider.
The New Data Wizard starts and you have the option to select Build a new query on the universe currently in use or Access new data in a different way.
Selecting the first option takes you to the Query Panel of the current universe, where you start building your additional query. The second option leads you to a option to create a report based on another universe, or access data from a Personal Data File like for example an Excel file.
In Web Intelligence Rich Client:
Choose Edit query from the Data menu. Choose Add Query in the Query Panel.
The Add Query Wizard starts and you have the option to select either the used universe(s) or from other available universes.
Selecting the first option takes you to the Query Panel of the current universe, where you start building your additional query. The second option leads you to a option to create a report based on another universe.
Combining Queries and Linking Data #
To create a new report table based on objects originating from different queries, you first need to adjust those Dimension objects that are considered as incompatible. They are greyed out in the Report Manager box, and you can not drag such an object into a combined report table.
Linking Dimension Objects #
Dimension objects from different queries with different object names, but holding the same data can be linked, for example objects Accounting Underwriting Year from the accounting structure with Underwriting Year from the business structure.
To Link Dimension Objects:
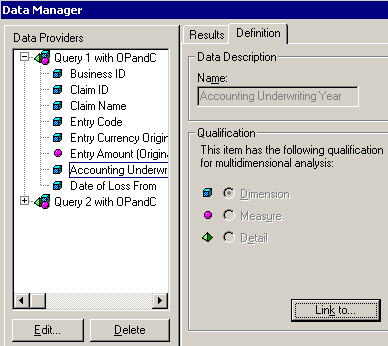
- Select View Data from the Data menu.
- In the Data Manager dialog box, select the Dimension object you want to link from the first query.
- Click the Link to… button.
 4. Select the object of the second query to be linked, and click OK.
5. The small arrows next to the objects confirm that they are linked together.
4. Select the object of the second query to be linked, and click OK.
5. The small arrows next to the objects confirm that they are linked together.
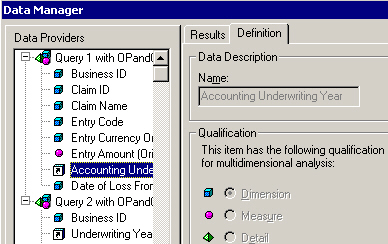 6. You have now created a link between Dimension objects holding the same type of data.
Create Detail Variables Associated with Dimensions #
For incompatible Dimension objects that have no equivalent object to be linked with, you have to create a local variable. It has to be qualified as a Detail object and associated with the referring Dimension object.
To Create an Associated Detail Variable:
- In the Report Manager box mark any object, right-mouse click and select New Variable from the menu. The Variable Editor dialog box opens.
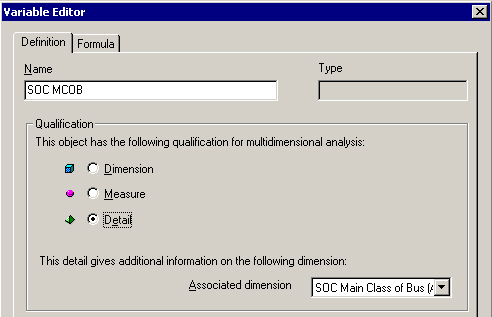
- Click the Definition tab, and enter a suitable name for your variable.
- In the Qualification box, click Detail to qualify the object as a Detail variable.
- In the drop-down list select the Dimension object you want your new Detail variable to be associated with.
 5. Click the Formula tab, and locate the associated Dimension object among the existing Variables and double-click it. The object name is displayed in the Formula field.
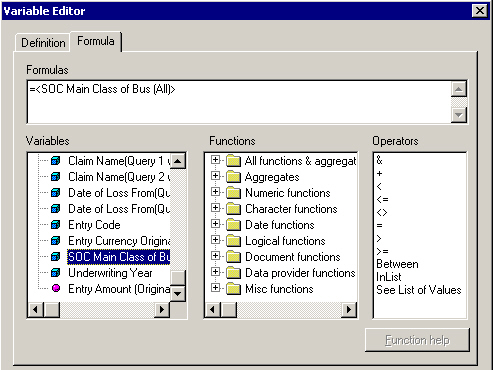 6. Click OK.
You can now insert a new report table with data from different queries, consisting of compatible objects, linked Dimension objects and Detail variables associated with Dimensions.
Avoid Duplicate Rows Aggregation #
If you create a query with only Dimension objects and Detail objects, but no Measure objects, BusinessObjects is by default removing all duplicated rows from the report.
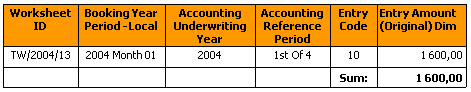
If your report has one or more Dimension objects representing a numeric amount (for example object Entry Amount Dim) and you want to show the total sum in the report, BusinessObjects returns the wrong totals as it has eliminated duplicated rows.
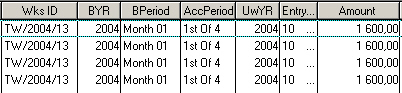
A report with the above example using the Dimension object for Entry Amount only shows one of the four rows and with a wrong total.
To Avoid Elimination of Duplication Rows:
- Select Table from the Format menu.
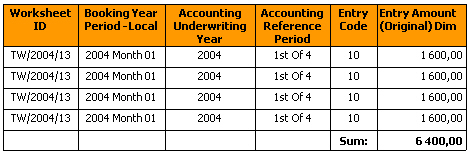
- Select the Avoid Duplicate Rows Aggregation check box on the General tab.
- Click OK.
- The previous eliminated rows are now displayed in the report.
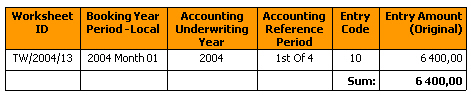
If you only are interested in getting the correct total and do not need to view each individual row, you can avoid this elimination problem by selecting a Measure object for the numeric amount.
Applying a Report Template #
It is possible to apply a template on your report table, which enables you to give all reports and documents a consistent look and feel. It also saves you time by including logos, layout styles and document structures automatically in new documents.
To Apply a Template on a Created Report:
- Select Report and Apply Template from the Format menu.
- Select a template from the list of Available Templates.
- Click OK.
- The selected template is applied with your report
Note! It is recommended that you select a template before you do any formatting of a report layout, since a template overwrites any other applied formats.
You can also build a new template. It can be useful to have a number of templates with different report layouts considering page settings, report breaks, crosstabs etc.
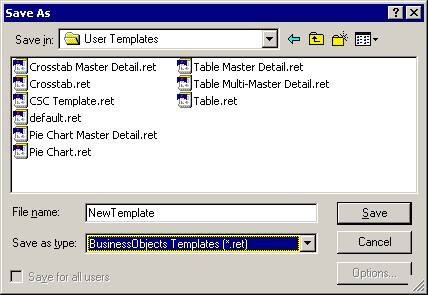
To Build a New Report Template:
- Create a query in a new document and run the query.
- Apply the desired layout formats and page settings to the default report table.
- Save the report document as a template in the Templates folder with the file extension ret.
Sending a Report to Other Users #
You can let other users access a report that you have created by sending it via email as a regular attachment, or via the repository.
Sending a Report via Email #
If you want to make a report accessible to a user working outside your repository, and send it via email, you have to click the option Save for all users in the Save As dialog box. If this is not done the recipient gets an error message and will not be able to open the report.
Sending a Report via Repository #
You can via the repository also send a report to one or several users working within the same BusinessObjects environment.
To Send a Report via the Repository:
- Select Send To - Users from the File menu.
- Click the To button for adding the desired user name(s).
- Click the Browse button to add the report(s) you want to send.
- Click the OK button, which export the report(s) to the repository.
- The recipient(s) can now retrieve the report(s) by selecting Retrieve_From - Users_ from the _File_ menu.
Running a Report without Retrieving any Data #
A report can very quickly become large and take up space on your company network when you distribute it to several colleagues. With BusinessObjects you can reduce the size of the report by running the report without retrieving any data.
It means that the report creates the necessary SQL, and you as the creator or user of the report can do all the formatting of the information. All components of the report (objects, conditions and sorts) are kept, but the data retrieved is deleted. When you later want to distribute the report to other colleagues, you run it without retrieving any information. The size of the report will be small and quick to send and retrieve over the network.
To Run a Report Without Retrieving Data:
- Click the Options button in the Query Panel. The Query Options dialog box opens.
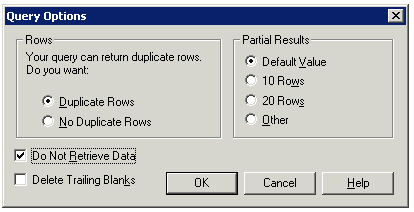 2. Select the Do Not Retrieve Data check box. The query will not connect to the database when it runs. When the query is refreshed the next time, this option is automatically switched off, meaning that the query connects to the database and the data appears in the report.
3. Click OK to return to the Query Panel.
4. When you have finished building the query, click the Run button.
5. The name of the objects included in the query appears as column headings in the report.
6. Save the report.
2. Select the Do Not Retrieve Data check box. The query will not connect to the database when it runs. When the query is refreshed the next time, this option is automatically switched off, meaning that the query connects to the database and the data appears in the report.
3. Click OK to return to the Query Panel.
4. When you have finished building the query, click the Run button.
5. The name of the objects included in the query appears as column headings in the report.
6. Save the report.